The All-in-One eCommerce Advertising Report Template [FREE]
Tired of having a bunch of different reports? Want to see all of your advertising reporting in one place? Get our eCommerce advertising reporting template.
Published November 5, 2024.
![The All-in-One eCommerce Advertising Report Template [FREE] main image](https://entail.mayple.com/en-assets/mayple/6357cd8ca09f4226830e993b_ecommerceadvertisingreporttemplate1_ec808102f982300e6f9871d340c1a91a_2000-1699775593744.png)
There's one thing that marketers hate the most, and that's making reports. It's the least glamorous part of the job. Who likes to integrate systems, look at spreadsheets, and plug numbers in when they could be posting selfies on LinkedIn?
It gets even more complex for eCommerce brands because there are so many different variables and advertising channels you need to report on. An average brand is probably running Facebook Ads, Google Ads, Google Shopping campaigns, TikTok, Pinterest, and email marketing to top it all off. And it's just a lot to keep track of.
Look, you may love to report your results, but you just don't want to spend 10+ hours creating slide decks from scratch for a 30-minute meeting with the executive team. And we're here to tell you that you don't have to.
We created a template to help you keep track of all your eCommerce advertising results in one place. Here's a brief explanation of what you need to have in an eCommerce report and how our template works.
Let's dive in.
What is an eCommerce report?
An eCommerce report shows you information about your traffic, sales, and engagement. Ecommerce reporting tools and dashboards make it easier for brands to learn about their customers, products, ad campaigns, marketing channels, and inventory by seeing the return on investment of each channel and marketing activity.
What should be included in an eCommerce report?
Ecommerce analytics reports should include data about sales, marketing campaigns, product performance, eCommerce site conversion rates, inventory stats, churn, returns & refunds, and much more. All your eCommerce marketing efforts should be summarized in one comprehensive dashboard (made up of several reports). And each report should focus on a particular key metric or marketing channel.
What kind of eCommerce performance reports do you need?
Most brands have a very hard time putting together all their marketing data. That's especially true if they have a different marketing agency working on each of their channels. Brands usually have one campaign report for Facebook Ads, another one for Google Ads, the third one for Twitter Ads, another one for email marketing, and so on. That's horribly inefficient.
You should combine all your eCommerce performance reports into one easy eCommerce report template. It should include all of your advertising channels (Google, Facebook Ads reporting, TikTok, and Bing Ads) and show metrics for a specific date range, and compare it with the previous period.
And that's not something your Google Analytics or your Shopify dashboard could show. They're great for showing organic traffic sources (like content marketing or email marketing) but they don't pick up ad attribution very well. You need to use either a marketing tool or a marketing template and plug in all the numbers for you.
Here is a list of metrics you should have in your monthly report.
The top eCommerce KPIs you need to track
The ultimate eCommerce performance report should have the following key metrics:
Revenue and net profit
The most important metric on any digital marketing report is the bottom line - how much money did this activity actually bring you? And it's important to look at the gross and net profit on each channel.
Average order value (AOV)
The average order value is essentially a measure of how much customers spend on each order. It's a super important metric that can help you determine if you need to put more effort into retention strategies.
Purchase frequency
Purchase frequency is another really important metric to know. It's the measure of how many purchases are made on average per customer. It helps eCommerce businesses understand the full potential revenue from each customer.
Customer lifetime value (CLV)
Customer lifetime value is the total amount of money your business can expect from each customer over their lifetime.
It's calculated by taking the average order value (AOV) and multiplying it by the purchase frequency. You could also take your total revenue and divide it by the number of customers to get a rough estimate of your CLV.
Impressions
Impressions are the measure of how many times your ad was viewed or seen on social networks and online platforms. You can find that information on your monthly marketing report on each platform. You will also find impressions on a social media report for your organic efforts there.
Add to cart %
This is the percentage of people that added your product to their shopping cart in a specific time period. It's the eCommerce equivalent of leads (or SQLs) in other industries.
Checkout %
This is the percentage of your users that have proceeded to checkout in a certain time period. It's an important number to break down by device and compare desktop vs mobile vs tablet checkout percentages.
Customer acquisition cost (CAC)
This is the measure of how much it costs you to acquire each customer. It should be really clear from your advertising campaigns what the CAC is and if you don't have clarity on it you will probably waste a lot of your marketing budget and a lot of resources on your marketing team.
Conversion rate
Your conversion rate shows how many people clicked through an ad and made a purchase. It's a critical metric that you will also see on a sales report or a CRO report.
Bounce rate
Use it for content marketing to show which pages resonate with your audiences the best. You can use Google Analytics to see which pages get the highest bounce rate and then optimize them to better fit the search intent of your target audience.
You can also use bounce rates to see how your product pages are performing. It's a great metric to use not only for search engine optimization campaigns but also for tracking site-wide engagement.
Return on ad spend (ROAS)
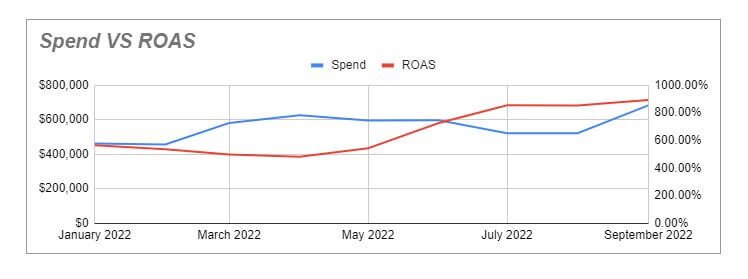
Return on ad spend is the measure of how much revenue you made from each specific advertising campaign. It's calculated by dividing total revenue by total spend.
Get our free eCommerce advertising report template
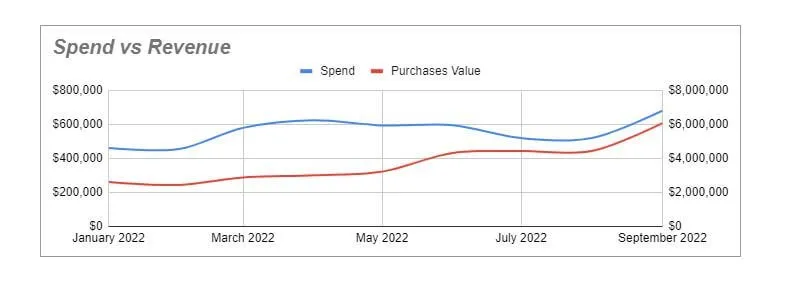
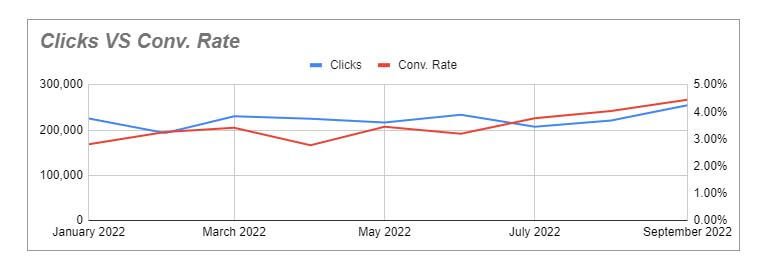
The good news is - you don't have to break your head trying to figure out how to create a custom report or a fancy dashboard in Google Data Studio. We've created an all-in-one eCommerce report template you can use to view all your advertising channel data in one place.
Remember our popular marketing planning template? Well, that one helps you plan out your marketing strategies and channels, and it's built for all kinds of businesses. This one is actually focused on eCommerce brands and specifically helps track advertising campaigns.
Get our FREE eCommerce Advertising Report Template Here.
FAQs
Is Google Analytics good for eCommerce?
Google Analytics is a free tool that has a lot of reports, features, and metrics that are specific to eCommerce. The drawback is that it's quite difficult to set up. So you're better off looking at your sales report on your Shopify or BigCommerce (which you already pay for if you're using those platforms).
What is the purpose of an eCommerce report?
An eCommerce report is used by eCommerce businesses to track sales, product performance, and shopping behavior of their customers, and get a quick snapshot of how the business is doing month to month.
It also helps improve the performance of specific sales channels and helps get your marketing and sales teams on the same page.
What's the difference between an eCommerce report and an eCommerce dashboard?
An eCommerce dashboard is a set of metrics and key performance indicators (KPIs) that relate to sales performance, organic traffic, marketing spend, and your overall marketing performance. Platforms like Shopify and BigCommerce have an overview dashboard under the analytics tab that displays all your various data.
An eCommerce report usually focuses on one particular metric and gives you more insight into it. A dashboard is usually composed of several reports put together.


![The eCommerce Holiday Readiness Guide 2024 [Updated]](https://entail.mayple.com/en-assets/mayple/fit-in/280x280/60b7581f89bea756cee92923_blackfridaysaleholidaysbanner_1dd9b5c88c26c47d9aa42e4eb2e8a050_2000-1699777158118.png)